The math was proving difficult and I wasn't getting a clear idea of the trends. When I noticed that the power
draw was going to go up and then down as the mosfet switched on, I realized this was going to require a table
(or a graph) to show me what was going on.
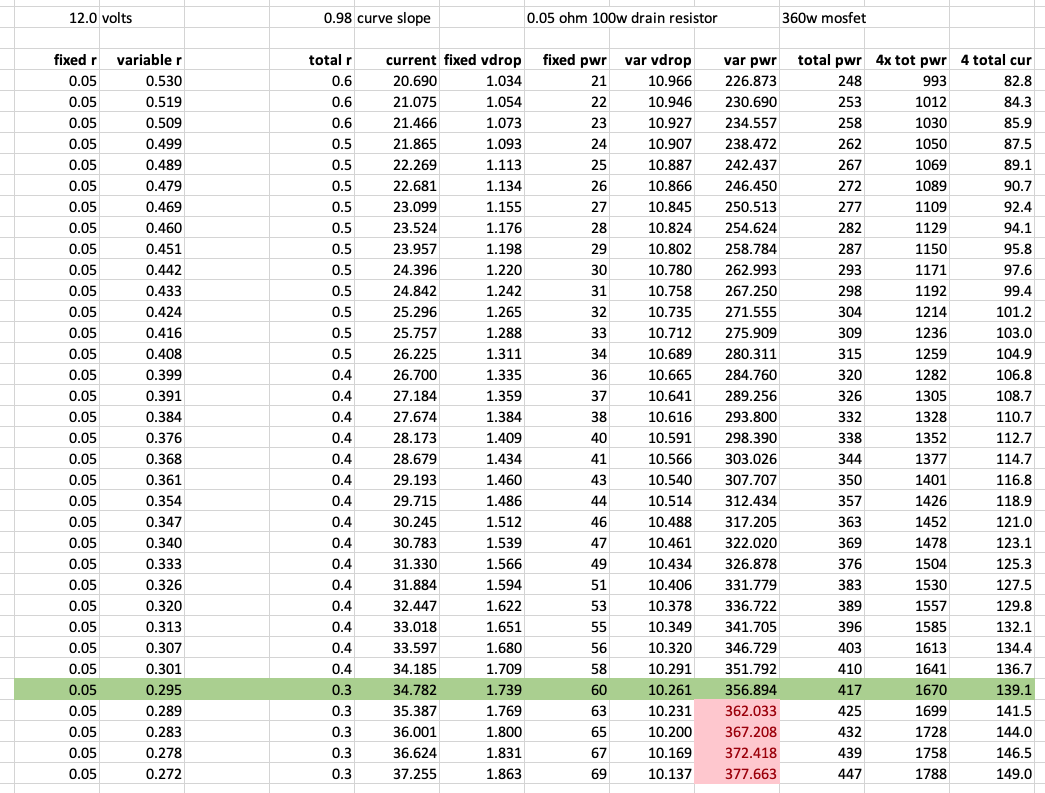
I set up a table with a fixed drain resistor and a variable mosfet resistance, to see how current and power
changed over time, and to see where the resistor and mosfet power dissipations were reaching their limits.
As it turned out, 0.05 ohms is about an ideal drain resistor for 12v power when using a 360w mosfet. Since I
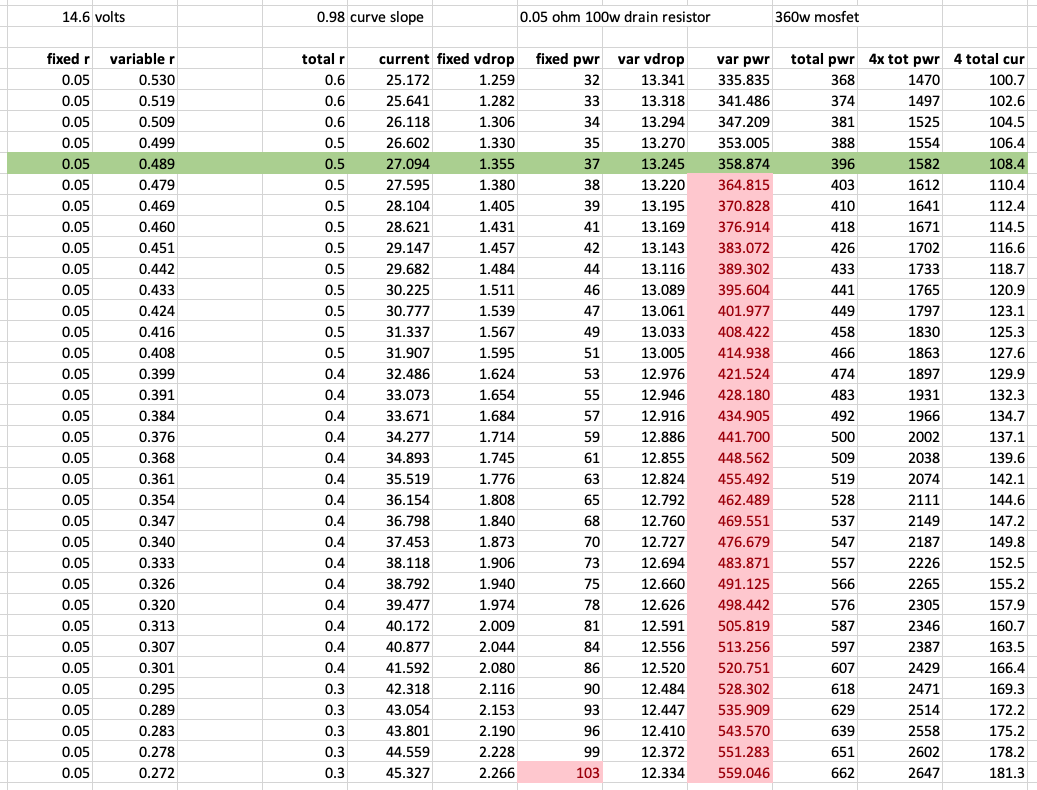
intend to test FLA and LIFE batteries, I generated two graphs based on the low (12.0v) and high (14.6) levels
that I intended to be loading. In both cases the mosfet reached its limit well before the drain resistor.
Part of the purpose of the drain resistor is I intend to run four mosfets in parallel, and this will help to
balance out any minor differences in performance. (it's much more critical to do this with BJTs)
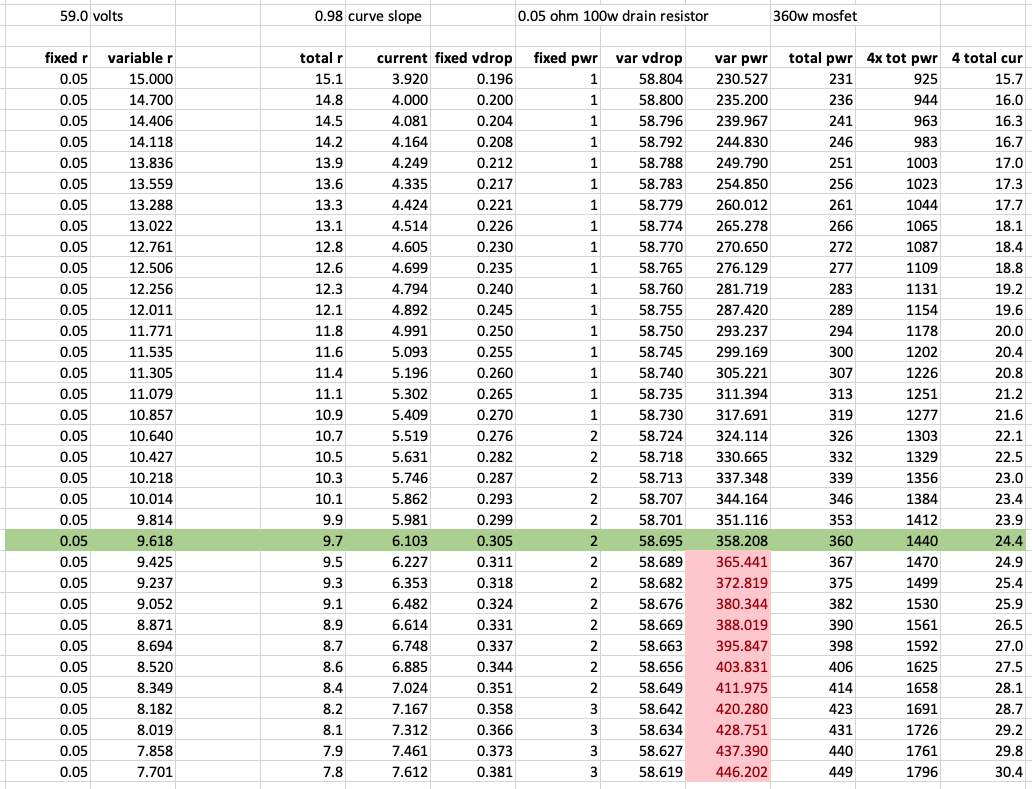
It looks like this design will be capable of drawing over 1,500 watts at 100-140 amps (depending on voltage)
which should meet my requirements for load-testing 80-100Ah batteries and 1,000w solar charge controllers.
It can also be connected directly to my 1,200w solar panel array. (which can generate 20 amps at 59v) It can
still draw 1,500+ watts of power, although that's almost entirely the mosfets, with the drain resistors idle.